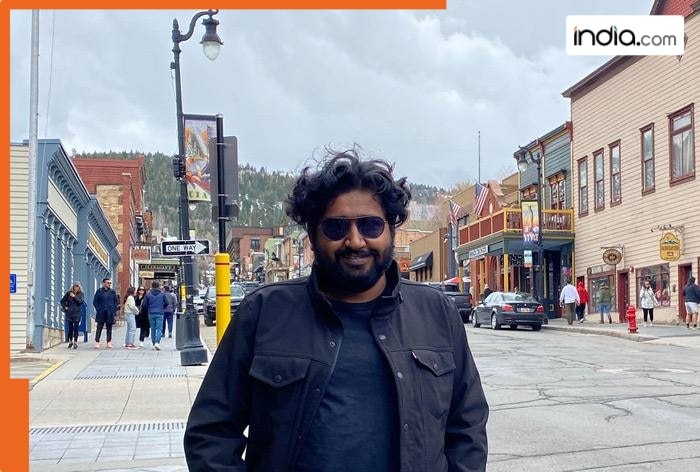
WHEN EVERY CLICK MATTERS: KIRAN GADHAVE ON HOW TO UNDERSTAND USERS BY WEB APPLICATIONS AND WHY IT MATTERS TO ALL OF US
By Priyanka Gupta
Copyright india
Interactive systems have become key tools in data analytics but most of them do not record the sequence of user actions. This makes it difficult to reproduce analysis explain findings and repeat research procedures.
Kiran Gadhave a software engineer and a computer science researcher is addressing this problem. His work aims to create systems that store not only the result but also the path the user took to get there. This increases the transparency and scientific reproducibility of analysis. Mr. Gadhave presented his research at Euro Vis 2022 in Rome (Reusing Interactive Analysis Workflows) and at the IEEE VIS Doctoral Colloquium in Oklahoma (Literate and Reusable Visual Analysis). He also served as a reviewer at CHI and Pacific Vis in 2022 and 2024. His approach suggests rethinking the role of visual analytics as a tool not only for discovering insights but also for accurately documenting analytical processes.
Today’s article explores how technologies like provenance tracking are shaping the future of data analysis education and interface design. We’ll examine real-world uses in science and business and offer practical tips anyone can start using today.
What is provenance tracking and how does it work?
Provenance tracking logs every action in a digital tool like clicks filters and data selections while also capturing the underlying logic. Used in science medicine business and education it enables repeatable research step-by-step learning and transparent decision-making.
Kiran Gadhave has been instrumental in creating Track a unique tool for provenance tracking that records and organizes every step taken during data analysis. This tool allows researchers and developers to review their process and understand how a result was reached. His system has been utilized in real-world research projects at top laboratories including the Visualization Design Lab at the University of Utah the Visual Data Science Lab at Johannes Kepler University and the Human Interaction Visualization Lab at the University of Toronto which consistently ranks in the global top.
“When we first started working on Track I didn’t expect it to grow beyond our lab” Kiran reflects. “Seeing it picked up by other researchers and used in different parts of the world has been both surprising and motivating. It shows that even small tools when well designed can have a real impact.”
Where is it being used?
Provenance tracking is used across science education business and software development. Researchers rely on it to document complex analyses making results easier to reproduce or share. In classrooms and labs it helps students reflect on their work and gives teachers insight into their thinking. Businesses use it to test ideas refine dashboards and understand decision-making logic. It also improves collaboration by enabling full-session sharing instead of scattered files or screenshots.
The system developed by Kiran is widely used for provenance tracking. The main academic paper about Track has received around 70 citations. The software itself is available as open-source and hosted on npm a popular platform where developers share reusable code. The different Track packages have been downloaded over 20000 times. Core to UpSet.app a tool with 100k+ annual genomics and data science users Track has become a foundational component in high-impact data analysis workflows. His work has also been presented at major conferences such as IEEE VIS (the forum is organized by the Institute of Electrical and Electronics Engineers (IEEE) the world’s largest technical professional organization for advancing technology) and Euro Vis and in 2023 he was invited to the Dagstuhl Seminar — one of the most respected academic gatherings in computer science.
“It’s gratifying to see the system used in real research and classrooms” Kiran comments. “The original idea was to make it easier to follow what happened during analysis and help people understand and build on their work.”
What can be done today?
Track your steps.
Recording your actions whether in a notebook spreadsheet or dashboard can boost clarity and reproducibility. Tools like Jupyter Notebooks or even Excel and Tableau become more powerful when you document what you did and why.
Explore essential data tools.
You don’t need a math degree to start. Python is great for analysis while JavaScript and TypeScript help build interactive tools. Libraries like d3.js and Plotly make visualizing data easier and more engaging.
It’s never too late to start.
Many data professionals began in unrelated fields like design or teaching. What matters most is curiosity persistence and the willingness to learn as you go.
Today Kiran is a successful Full-Stack Software Engineer at Imply Data known for its cutting-edge analytics platform and selective hiring process. He is also a member of Sigma Xi the Scientific Research Honour Society one of the worlds oldest and most respected scientific organizations which counts over 200 Nobel Prize winners among its past and present members. But it wasn’t always like that.
“When I started grad school I didn’t have an academic background in computer science” he says. “I had worked as a software developer in India but I had never taken CS courses or done research. I had to work hard to catch up on the undergraduate computer science material while taking graduate-level classes. What mattered most was the willingness to keep moving forward.”