September 30, 2025
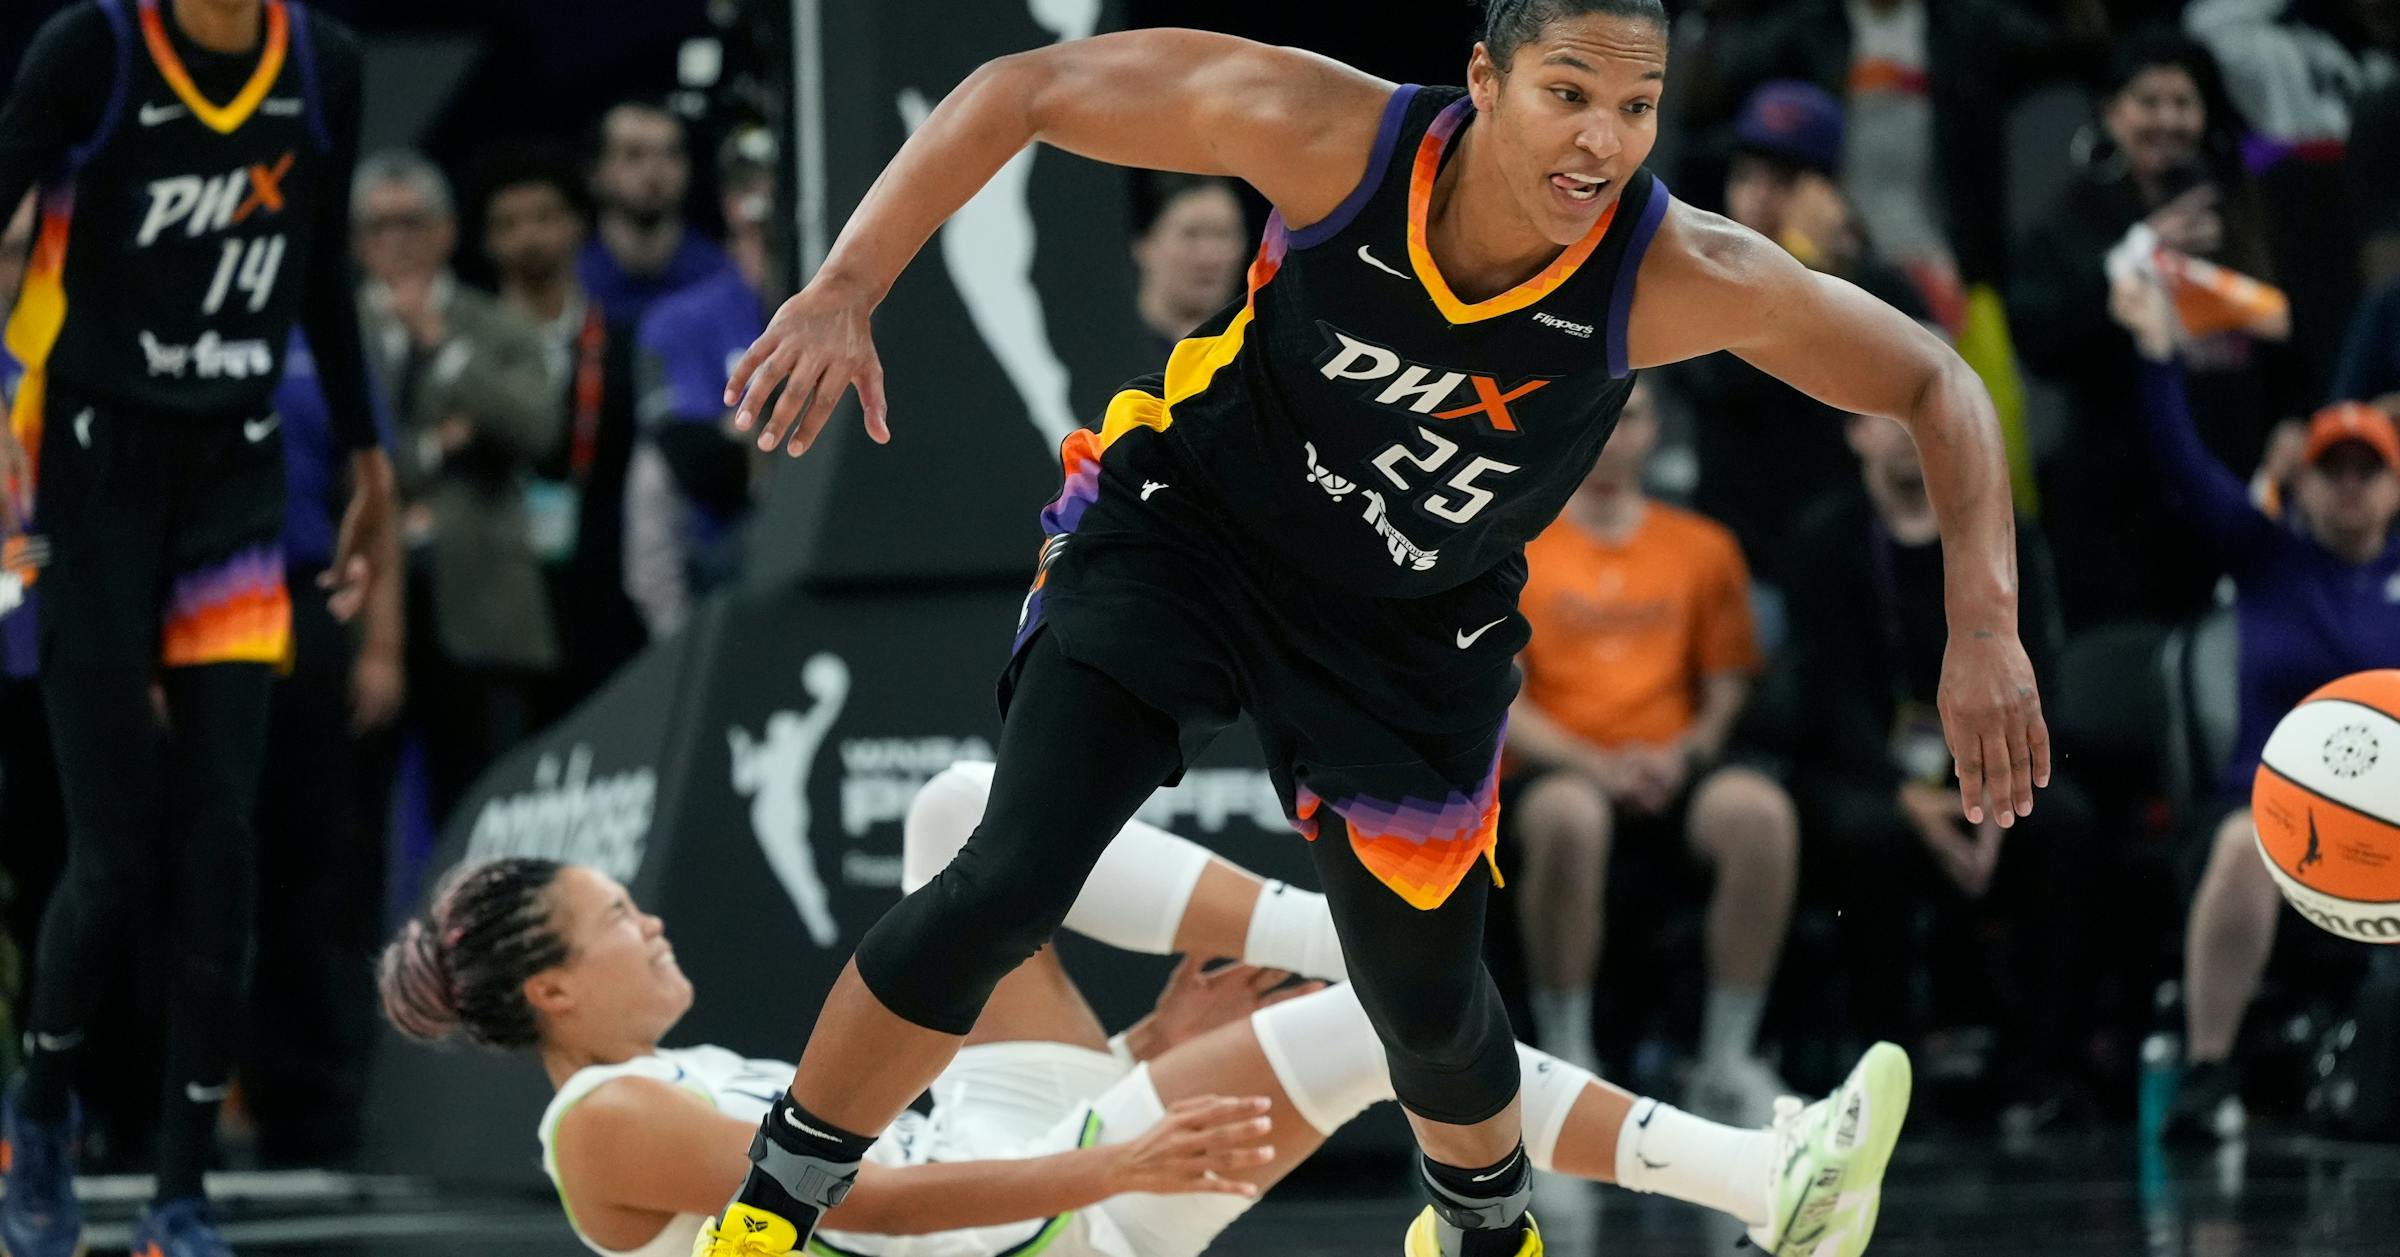
Napheesa Collier of the Lynx goes down after colliding with Mercury forward Alyssa Thomas in Game 3 of the WNBA semifinal series Friday in Phoenix. Collier was injured on the play, tearing ligaments in her left ankle. (Ross D. Franklin/The Associated Press)
Comparing their regular season stats to the playoffs show how the game’s shift to more physicality in the postseason is harder on the Lynx.
By Jim Foster
The Minnesota Star Tribune
ADVERTISEMENT
Rarer 3s don’t always mean losses
Ball movement often leads to good looks beyond the 3-point arc, but facing stronger defenses in the playoffs, the Lynx often struggle to improve their made 3s into the postseason. They’ve only done it four times.
Last year’s team saw their biggest drop in 3-pointers in the playoffs and yet nearly turned it into a championship.
It’s worth noting that in 2018, 2019 and 2021, the Lynx lost single-elimination first-round playoff games, making the per game averages for those seasons a very small sample size.
Points on the board is more consistent
If there’s one metric that has become more even over time, it’s points per game. In 2012, 2013 and even 2018, the Lynx were struggling to put up as many points in the playoffs as they did in the regular season.
Now? They’re nearly even.
about the writer
Jim Foster
Graphics Producer
Jim Foster is a graphics reporter/producer who began his career at the Minnesota Star Tribune in 1985. He specializes in graphics for the Business section.
See More