Copyright Charleston Post and Courier

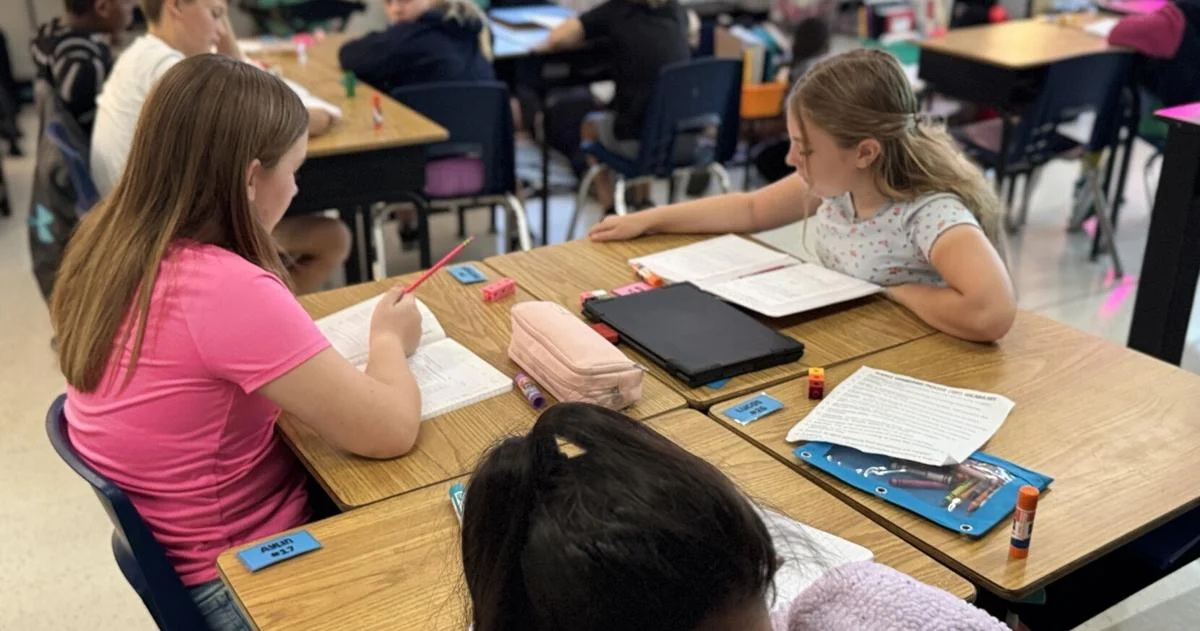
COLUMBIA — Education leaders are applauding measurable improvement among the state’s roughly 1,200 public schools with the release this week of the annual South Carolina Report Cards. Each public school and school district in the state receives an overall rating in the annual reports — ranging from “unsatisfactory” to “excellent” — and the number of schools earning a “good” or “excellent” rating increased from 549 in 2024 to 623 this year, according to an announcement from the South Carolina Department of Education. Results, heavily tied to high school end-of-course exams and SC READY results among elementary and middle school students, were consistent with the state’s higher test scores this year. The report cards were released on Nov. 3, nearly three weeks later than planned because of problems with some of the graduation data. “These report cards tell a clear story: South Carolina students and educators are rolling up their sleeves and getting results,” S.C. Superintendent Ellen Weaver said in a statement. Contained within the report cards for each school is a snapshot of data that helps schools and districts benchmark their performance statewide while keeping them accountable to federal funders. The reports also have some teeth. District offices and the state launch corrective actions — including the possibility of a state takeover — among high schools that graduate fewer than 67 percent of students on time, high-poverty schools struggling the most, and schools with student groups — including those with disabilities — whose performance is too low. Similarly, a charter school that scores “Unsatisfactory” three years in a row faces closure. Critics of the system, including Rep. Neal Collins, a Pickens County Republican, have called out the reports as absurdly complex and unwieldy — because of their fall timing — to parents who might want to use them to find the best school for their children. “What parents are going to uproot their child in November because they finally find out that their school was below average last year?” Collins wrote on social media Oct. 15 when the education department announced the 2025 report cards would be delayed. Still, individual schools and school districts track the results carefully, competing as they are in an environment of limited financial resources, a declining pool of certified teachers and increased competition from charter schools, magnet schools, voucher-funded private schools and — especially since COVID — a spiking homeschool population. Patrick Kelly, director of governmental affairs for the Palmetto State Teacher’s Association, said that beyond the federal and state accountability piece, the Report Cards’ public-facing rating of schools also boosts real-estate prices and community bragging rights. And school boards typically consider report card ratings when assessing a local superintendent’s performance, he added. “This means superintendents are going to look at the data as part of their annual review of principals,” Kelly wrote in a text to the newspaper. “This means principals are going to look at the data as part of their annual evaluation process with teachers.” Results Report cards for South Carolina public schools dating back to 2018 are available at screportcards.com. A snapshot of each district is also available at screportscards.com/explore-districts. The genesis of the report cards is a federal law — the 2015 Every Student Succeeds Act — that requires states to publish annual reports if their school districts receive “Title I” financial support for low-income students — which includes every school district in South Carolina and about 95 percent nationwide. In South Carolina, math and English test scores factor most heavily at the elementary and middle level — 80 percent — but science scores and student-teacher surveys also play a role. At the high school level, ratings are driven by on-time graduation rates (31 percent), end-of-course exams (35 percent) and assessments that show college or career readiness (19 percent). Student-teacher surveys and English scores of foreign-language students also factor in somewhat. In Richland and Lexington counties, not a single school was “unsatisfactory” in 2025 — a marked improvement for the area. Columbia’s Richland One had four campuses in that lowest designation last year, but this year nine campuses improved an entire rating level, including two elementary schools that jumped by two levels and one additional “excellent” campus. It’s the first time that Richland One had no “unsatisfactory” campuses since the report card system started in 2001. Its graduation rate slightly increased, while its college or career readiness rate climbed by almost 14 percentage points. Annie Burnside Elementary School, a high-poverty campus in Lower Richland, jumped from “average” to “excellent” in one year, an example of “beating the odds” that Weaver attributed to Principal Janet Campbell’s leadership. “At Burnside, ‘I can’t’ is not an option,” Campbell said, as she struggled to hold back tears. Neighboring Richland Two, in the northeast portion of the county, also saw growth as the district’s graduation rate held steady and its college or career readiness rate ticked up slightly. Its number of “excellent” campuses doubled from three to six. In central Lexington County, nine of Lexington One’s schools were deemed “excellent,” as both its graduation and college or career readiness rates also improved slightly. In Greenville County, the high-school graduation rate — 90.6 — was a particular point of pride for the state’s largest school district. None of the schools there or in Spartanburg County were “unsatisfactory.” Four of Greenville’s 15 high schools had graduation rates exceeding 95 percent while the two lowest rates were at Carolina (77 percent) and Berea (78 percent) high schools. Districtwide, 98 percent of Greenville County public schools scored “excellent,” “good,” or “average,” according to a release from the district. This was a nine-point increase over 2024, and two of every five schools got an “excellent” rating. “From early learning through high school, our students, staff, families and community partners are working together to ensure that every student graduates prepared for the next step — whether that’s college, career, or military service,” Greenville Superintendent Burke Royster said. In Charleston County, public schools surpassed the state in most metrics, including academic achievement, college and career readiness, and graduation rate. In total, 57 Charleston schools achieved the top two rating levels, while three schools received an unsatisfactory rating this year. The district showed significant growth particularly at the elementary level. Of the 22 schools that improved in one or more rating levels, the majority were elementary schools. Superintendent Anita Huggins teased some of the report card results in her recent State of the Schools address, where she highlighted Stiles Point, Angel Oak and Sanders-Clyde Elementary, a school serving over 97 percent of students living in poverty. The gains reflect the impact of early-grade reforms such as phonics-based reading instruction, the use of formative assessments and expanded literacy and math interventions, according to a press release. Multilingual learner progress in Charleston was modest compared to last year, but remained below the state average.


