Copyright forbes

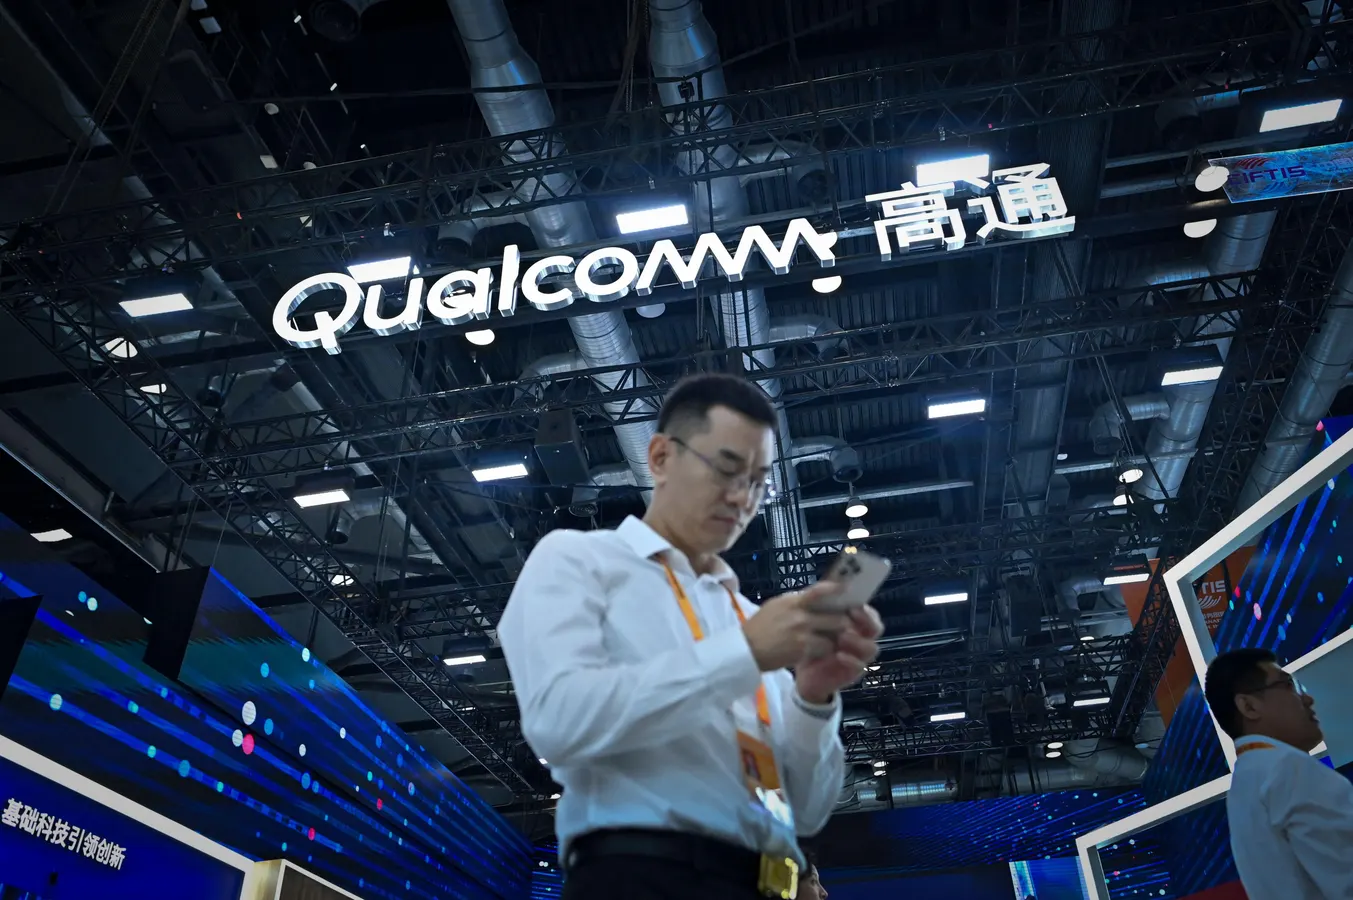
Over the past decade, Qualcomm (QCOM) stock has returned a significant $87 Bil back to its investors through tangible cash in the form of dividends and buybacks. The company’s cash generation is driven by its chipset sales in the mobile device, automotive, and IoT sectors, and high-margin royalty income from its extensive intellectual property portfolio in communication technologies. A man uses his mobile phone near a Qualcomm stall at the China International Fair for Trade in Services (CIFTIS) in Beijing on September 4, 2023. (Photo by WANG Zhao / AFP) (Photo by WANG ZHAO/AFP via Getty Images) AFP via Getty Images Interestingly, QCOM stock has achieved the 22nd highest return to shareholders in history. Let's examine some figures and compare how this payout capability measures against the largest capital-return companies in the market. Why should you be concerned? Because dividends and share buybacks offer direct, tangible returns of capital to shareholders. They also indicate the management’s confidence in the financial stability and ability to generate sustainable cash flows of the company. Furthermore, there are additional stocks that fit this profile. Below is a list of the top 10 companies ranked by the total capital returned to shareholders through dividends and stock repurchases. Picking stocks tends to fail more often than succeed. High Quality Portfolio transforms insights from individual stocks into a robust portfolio strategy that outperforms the market. MORE FOR YOU Top 10 Stocks By Total Shareholder Return To view the complete ranking, visit Buybacks & Dividends Ranking What do you observe here? The total capital returned to shareholders as a percentage of the current market cap seems inversely related to growth potential for reinvestments. Companies such as Meta (META) and Microsoft (MSFT) are expanding at a much quicker pace in a more predictable manner than others, yet they have returned a lower percentage of their market cap to their shareholders. That’s the counterpoint to high capital returns. Indeed, they may be appealing, but you should ask yourself the question: Am I compromising growth and sound fundamentals? With that consideration in mind, let’s review some figures for QCOM. (Refer to Buy or Sell Qualcomm Stock for further information) Qualcomm Fundamentals Revenue Growth: 15.8% LTM and 1.4% last three-year average. Cash Generation: Nearly 26.9% free cash flow margin and 27.8% operating margin LTM. Recent Revenue Fluctuations: The lowest annual revenue growth in the last three years for QCOM was -8.4%. Valuation: Qualcomm stock is valued at a P/E multiple of 17.7 Opportunity relative to S&P: Compared to the S&P, it offers lower valuation, higher LTM revenue growth, and better margins Fundamentals That’s a succinct overview, yet analyzing a stock from an investment standpoint entails much more. This is precisely what the Trefis High Quality Portfolio accomplishes. It's designed to mitigate stock-specific risks while providing upside exposure. QCOM Historical Risk Nonetheless, QCOM is not exempt from significant declines. It plummeted nearly 79% during the Dot-Com bubble, dropped about 48% amid the Global Financial Crisis, and fell roughly 44% during the inflation shock. Even more modest pullbacks, such as those in 2018 and the Covid pandemic, resulted in over 30% losses each. Strong fundamentals are important, but when the market shifts, QCOM can still experience substantial losses. However, the risk isn't confined to major market downturns. Stocks can decrease in value even during favorable markets – consider events such as earnings announcements, business updates, and outlook changes. Refer to QCOM Dip Buyer Analyses to understand how the stock has bounced back from significant downturns in the past. The Trefis High Quality (HQ) Portfolio, consisting of 30 stocks, has a history of consistently outperforming its benchmark, which encompasses all three – the S&P 500, S&P mid-cap, and Russell 2000 indices. What accounts for this? Collectively, HQ Portfolio stocks have yielded superior returns with lower risk compared to the benchmark index, resulting in a less tumultuous experience, as illustrated in HQ Portfolio performance metrics. Editorial StandardsReprints & Permissions


