By Carlos Ferrás Sexto,Catedrático de Geografía Humana,Universidade de Santiago de Compostela
Copyright theconversation

Have you ever mentally mapped out the streets between your home and your workplace or favourite café, focusing solely on those two places without visualising what exists in between them? If you have, you will know that in our minds, it often seems there is no distance between the places that interest us… or at least not as much as there really is.
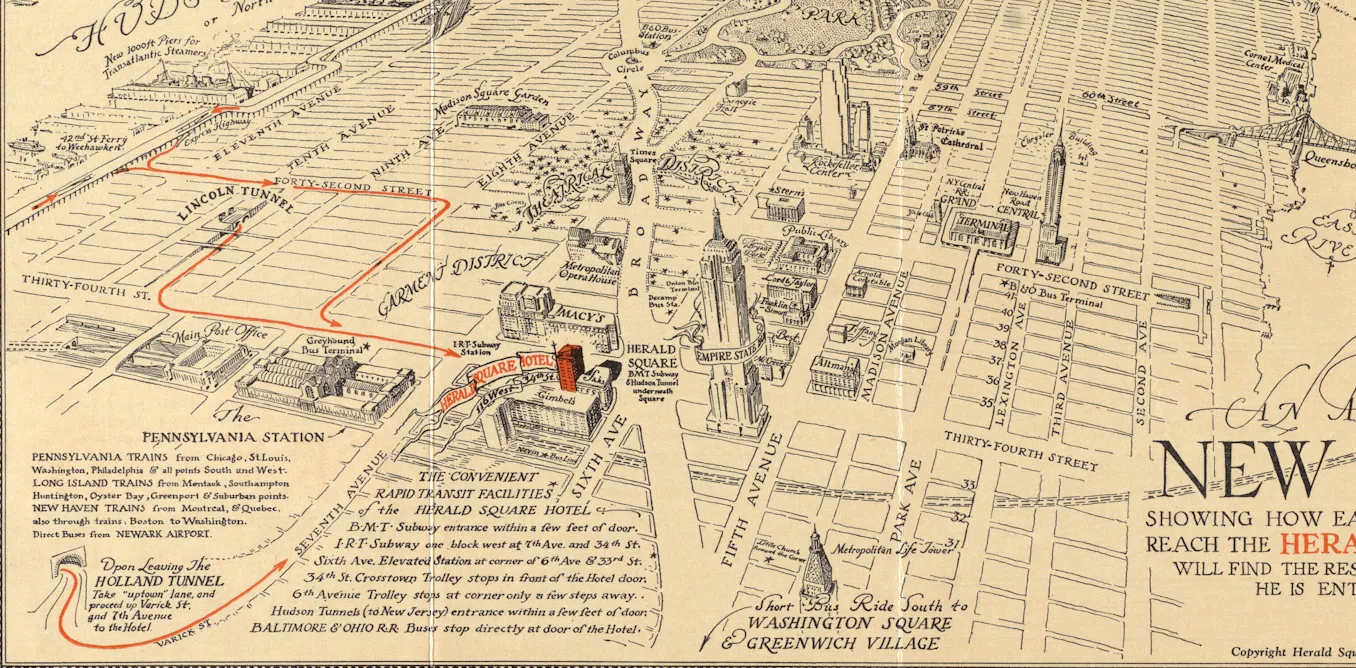
People tend to represent space topologically, that is, by looking at how the places we know and inhabit are organised and related to each other. We call these subjective graphic representations of lived space mental, or psychogeographical, maps. These depictions allow us to freely interpret the landscape in relation to emotions.
Perceiving ourselves in space
Mental maps are the result of our subjective perception of the spaces where we live.
You might, for instance, make a map of where you meet up with university friends, or of a neighbourhood with places you like to visit regularly. You might be able to distinguish positive or negative feelings and perceptions about these places – they might feel pleasant or unpleasant, relaxing or stressful, safe or unsafe, scary, happy, sad, and so on.
These maps also allow us to observe people’s spatial thinking – they tell us how we orient ourselves, how we structure space and how we identify landmarks, boundaries, neighbourhoods, paths and nodes. They are graphic representations of the environments where we usually move, live and grow, and they are considered valuable cognitive resources in the geography of perception.
A person’s level of cognitive maturity and their capacity for abstract spatial thinking determines their ability to create a structured map – the map itself may have varying degrees of detail and complexity, but this is independent from any actual cartographic quality. They also help us to analyse how each person perceives their living space, as well as the habits, values, beliefs and feelings they have.
Furthermore, they allow us to recognise “funds of knowledge”. This term refers to everything we know and learn – culturally, institutionally, socially, geographically – throughout our lives.
Read more:
Why do metaphors of space help us understand time?
Know the movements, know the person
This relationship between spaces and the mind has birthed new geographical subdisciplines, such as the emotional geography, psychogeography, and psychoanalytic geography.
These fields examine the moods of chronically ill patients or other social groups, seeking to identify the interrelationship between emotions, human behaviour and physical places, as well as the wider social, cultural and economic environment. This kind of study shows, for example, how the prevalence of depression decreases as people’s spatial mobility increases, bringing about more social interactions, experiences and perceptions of places.
Technology opens up new possibilities in the study of this field. Data that has been georeferenced through mobile phones, locations shared on the internet and digital payment transactions provide information about people’s daily lives. This allows for the creation of personalised mood maps that pinpoint places of greater or lesser stress in daily life. In this way, the emotions of the places we access physically or via the internet are mapped, as are our feelings and experiences.
These maps can then be used to offer psychological therapies that focus on analysing the places where people spend their daily lives, treating mental health as a priority. For example, in the case of anxiety disorders, we can identify toxic places than engender fear, and analyse the triggers in those places at those times.
The census as an instrument of care
This field also has great potential for transdisciplinary research among geographers, psychotherapists and computer engineers.
We can take the case of the United States as an example. Here, we have the precedent of what is known as the “Geography of Despair” – data compiled from a telephone survey on the state of mind of more than 2.4 million people in the US. The aim was to assess mental health on a geographical level, and to obtain information for planning and organising health services, with a view to directing resources to where they were most needed.
This project could be taken even further by combining it with other datasets to produce psychogeographical reports. We could use, for instance, census data. In the US, the smallest unit of measurement used to collect demographic data in population centres is the census tract. If we analysed census tracts, we could combine statistical data with people’s environment and behaviour to produce more accurate results.
Psychogeographical research could also address challenges in Europe, such as analysing the connections between disorders like anxiety or depression and their relationship with the homes of those affected. Statistical indicators could include residential density, available living space per dwelling, green spaces, cultural facilities, unemployment, medication, ageing and violence against women.
In Spain, for example, sub-municipal census data could be compared with census tracts in the United States. This could help future research to identify areas of particularly high incidence in order to select communities for trials or research. This psychogeographical data could then, in turn, help establish community-based psychosocial therapies in vulnerable areas.
By expanding our ability to map out the space we occupy in this way can help us, as a society, to manage how we feel while inhabiting it.
A weekly e-mail in English featuring expertise from scholars and researchers. It provides an introduction to the diversity of research coming out of the continent and considers some of the key issues facing European countries. Get the newsletter!


