By Giulia Carbonaro
Copyright newsweek
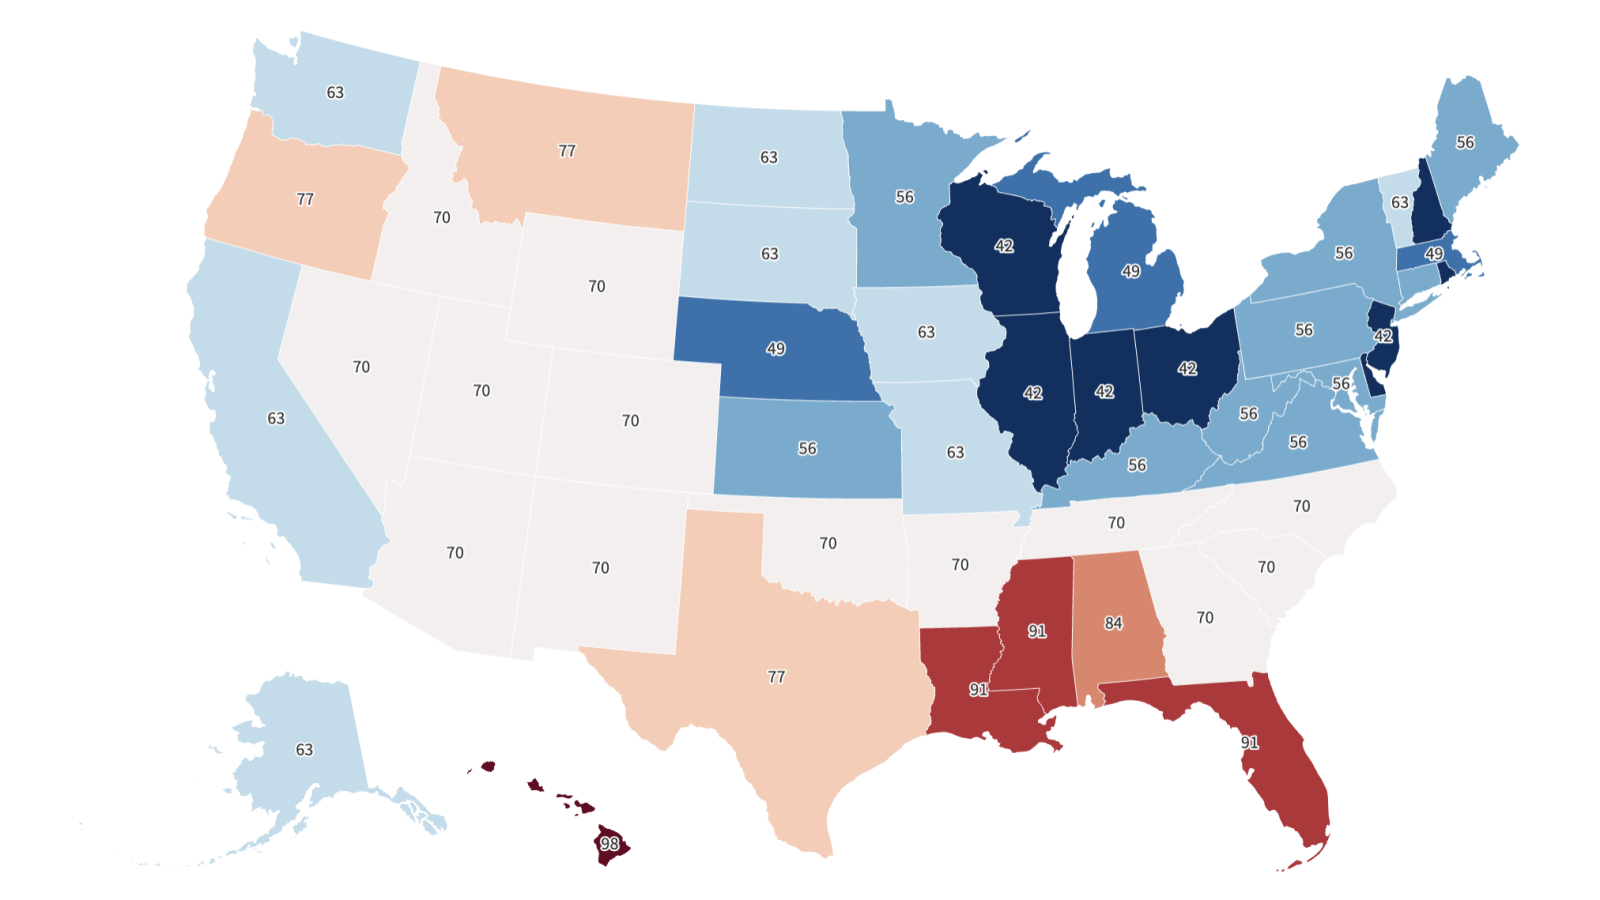
Single-family homes are taking longer to sell in the South than in the rest of the country, with listings in Florida, Mississippi, and Louisiana sitting idle on the market for a record 91 days before going under contract, according to data from Altos Research and Compass.Alabama followed closely with an average of 84 days spent by listings on the market before a sale was concluded.On the other hand, homes in the Midwest are selling roughly twice as fast as these markets continue to attract competitive buyers. In Illinois, Indiana, Ohio, and Wisconsin, homes for sale spent an average of 42 days on the market before going under contract—the shortest span of time in the nation. New Jersey also reported an average of 42 days.Mike Simonsen, founder and CEO of Altos Research, described the “bifurcation” in the country as “so stark” on social media.Newsweek contacted Simonsen for comment by email on Monday early morning, outside of standard working hours.What Does This Data Tell Us About the U.S. Housing Market?The number of days homes spend on the market before going under contract has been rising steadily since April 2024. As of July, according to Redfin data, the typical U.S. home spent 43 days on the market before being sold, seven more than a year earlier.That is because buyers have been retreating from the market due to ongoing affordability issues, including still-rising home prices, historically elevated mortgage rates, and growing economic concern linked to government policies. According to Redfin, 479,484 homes were sold in the U.S. in July—1.3 percent fewer than last year.As a result, the market has slowed down since the beginning of the year, with inventory piling up and giving buyers an opportunity to negotiate prices down with sellers. In the same month, according to Redfin, inventory was up 14.2 percent year-over-year nationwide, for a total of 2.17 million homes for sale.The number of days that homes spend on the market before being sold tell us whether the market is a buyer’s or a seller’s one. A low number indicates a seller’s market, usually characterized by high demand and quick sale. A high number indicates a market where buyers have more options and more negotiating power, and where sellers take longer to close a deal on their properties.Why Is the South Faring Worse?The South experienced a boom in housing demand during the pandemic home-buying frenzy, as the region saw an influx of newcomers coming from more expensive markets who had been freed by the rise of remote work.At the time, many moved to these states because they were more affordable, had better weather, and a lower tax environment. But the addition of so many people had the unwanted consequence of sending home prices in these markets through the roof, hurting locals’ ability to buy.Homebuilders in states like Florida and Texas responded with a construction boom as they tried to ride the wave of increased demand, but the new listings landed on the market as the movement of people to the South was slowing down to pre-pandemic levels and Americans all over the country were being pushed to the sidelines by higher costs.”The demand for people who wanted to move from North to South got pulled into the pandemic. So now there are fewer movers,” Simonsen said on X.The result is that inventory is now very high in these states, but demand has not kept up. Instead, it is growing in states in the Midwest, which have remained relatively affordable through the past five years, but where inventory is tight.”We’ve been moving from the North to the South for a long time. Sell in Ohio and buy in Orlando. But since it got expensive to move, we stopped,” Simonsen said. “A young family in Ohio still needs to buy. They can’t buy from the guy who moved to Florida, because he didn’t. So, the market is tight in Ohio, and much softer in Florida.”