Copyright newsweek
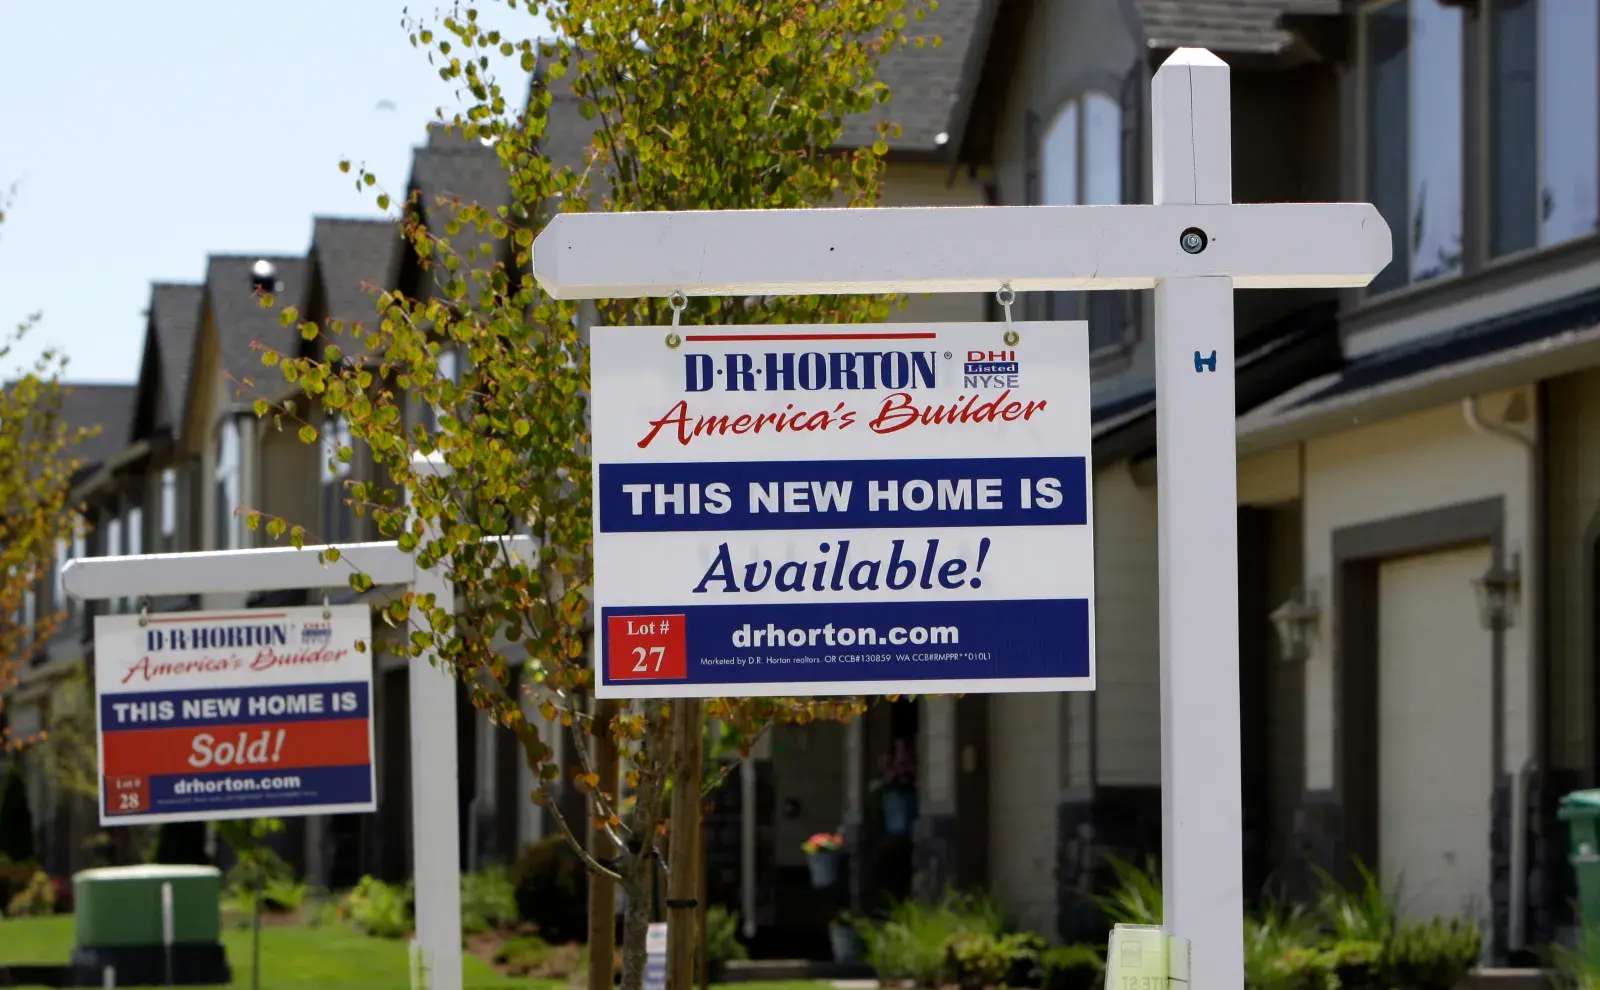
Home prices in the United States have soared dramatically in every state over the past half-century — but nowhere more than on the West Coast. A new analysis by Realtor.com highlights the cities where property values have surged the most since 1975. The data show that the largest gains occurred in California and other West Coast markets, while many Midwestern and Southern cities saw increases below 30 percent. Why It Matters The findings highlight how uneven housing growth has deepened America’s geographic and economic divides. New homes are shown Wednesday, May 27, 2009, in Happy Valley, Ore. Buyers who were brave enough to dive into the market for a bargain-priced house helped provide a modest boost to sales last month. (AP Photo/Rick Bowmer) What To Know A map based on data from Realtor.com reveals that San Jose has seen the sharpest surge in home values since 1975, climbing by 396 percent. In 2024, amid the artificial intelligence boom, San Jose became the first U.S. city where the median single-family home price exceeded $2 million. As of September 2025, the city remained the country’s most expensive housing market, with a median listing price of $1.36 million. San Jose is followed by San Francisco (300 percent) and Los Angeles (292 percent). Other West Coast metros, including Seattle (280 percent), San Diego (271 percent) and Portland (154 percent), also recorded some of the steepest long-term gains. On the opposite coast, long-established financial and educational centers also saw major increases. Boston recorded a 196 percent rise in home values, while New York posted a 161 percent increase — matching Denver. By contrast, cities across the Midwest and South saw much smaller increases. Memphis and Cleveland recorded just 2 percent growth in home values since 1975. Birmingham followed with a 9 percent rise, while Pittsburgh’s values were up 26 percent over the same period. “Not only were manufacturing jobs offshored, resulting in job losses and economic plight, but many of these places did not have the capital—financial or human—to reinvent themselves as tech and finance forward hubs,” Realtor.com senior economist Jake Krimmel said. As of September, Pittsburgh had the lowest median listing price among major U.S. cities at $254,950, followed by Cleveland at $259,950. What People Are Saying Realtor.com senior economist Jake Krimmel said: “In short, the U.S. moved from a manufacturing to a service and information economy and that evolution impacted different places through their labor and housing markets. Some areas were huge winners from that shift, while some got the short end of the stick.” What Happens Next Redfin forecasts that U.S. home prices will fall by about 1 percent by the end of the year compared with 2024.