Copyright majorcadailybulletin

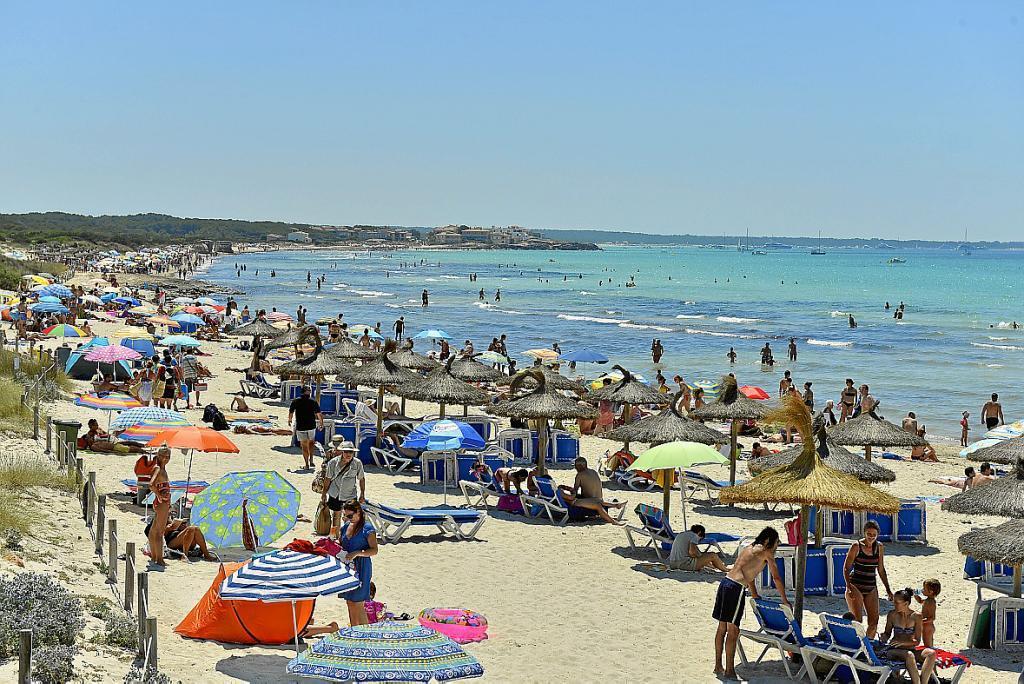
In August, the human pressure on the Balearics varied from island to island, with an increase of 1.4% in Mallorca and 3.4% in Formentera, and a sharp decrease of 4.5% in Ibiza and a very slight fall of 0.09% in Menorca. In the Balearics as a whole, the daily average population in August stood at 2,005,000, 0.57% less than in the same month last year, according to the Human Pressure Indicator (IPH) corresponding to the time of year when the islands have the highest concentration of residents and tourists, published on Wednesday. The maximum HPI reached in August was 2,062,787 people, 0.65% below the record reached in August 2024 - 2,076,276 people. The day with the highest demographic pressure of the month was 6 August, with 2,062,787 people, and the lowest was 31 August, with 1,861,821. In August, Mallorca reached a historic high in terms of human pressure with 1,492,531 people, 0.14% more than last August. The average population on the island also reached a record high this August, with an average of 1,454,854 people during the month, which is 0.36% more than in August 2024. Menorca reached a maximum pressure of 230,833 people, 0.09% higher than the same month last year and also an absolute record for the island. The average for August stood at 218,946 people, 0.3% above the most populous month of last summer. In Ibiza, the maximum IPH was 316,843 people, 4.5% below August 2024. The average IPH is below 300,000 people, with 297,307 this August, 5.9% lower than the same month last year. In Formentera, the maximum IPH this August was 35,729 people, 3.7% more than in August last year, far from the record reached in August 2017 - 40,994 people. The average for Formentera in August was 33,893, 3.7% above the average IPH for August 2024. Ibestat has had separate data for Ibiza and Formentera since 2016. The Balearic government has highlighted that, for the second time since records began in 1997, and except for 2020 due to Covid, the maximum Human Pressure Index has decreased consecutively in the peak season summer months of June, July and August, something that had only happened in 2009. Only on four occasions - also excluding 2020 - had the maximum HPI fallen in August: 2009, 2013, 2018 and 2025. The government considers the data published on Wednesday to be ‘very positive’ and highlights that it ‘reflects the success of the government’s tourism strategy’, marked by ‘restricting tourist arrivals, which helps to reduce human pressure’ and by the objective of ‘growing in value rather than volume’. A "human pressure index" is a metric used to quantify the impact of human activities on the environment. It combines various indicators, such as population density, agriculture, and forest loss, to assess the degree of human influence on a specific area, from local wetlands to global landscapes. These indices are valuable tools for conservation, landscape management, and understanding human-environment interactions, but some, like the Human Footprint Index, can lag behind current conditions due to data and modeling requirements. What it measures Direct and indirect impacts: The index considers a wide range of human activities, including urbanization, infrastructure (like roads and railways), agriculture, and resource use. Environmental pressure: It is used to assess how these activities affect the natural environment, such as forests, wetlands, and lakes. Vulnerability: It can indicate potential vulnerability in areas like protected zones, which might experience increased pressure during crises that disrupt local economies and supply chains. How it's used Conservation planning: Helps identify areas that are most affected by human activity to inform conservation strategies. Landscape management: Provides a tool for managing natural resources and understanding human-environment interactions. Scientific research: Researchers use it to study the effects of human pressure on ecosystems, track changes over time, and compare pressure levels in different regions.


