Copyright ZeroHedge
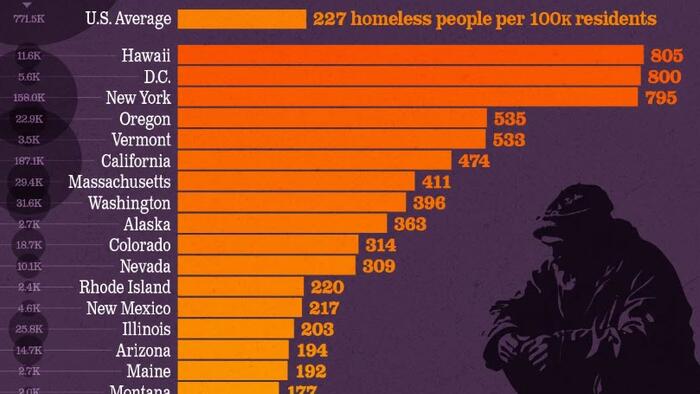
There are around 772,000 homeless Americans (nearly 230 for ever 100,000 Americans), according to the last time a point-in-count assessment was done in 2024. In this visualization, Visual Capitalist's Pallavi Rao, take a look at the highest homelessness rates by state, measured per 100,000 residents. The data for this visualization comes from the U.S. Department of Housing and Urban Development, paired with 2024 population estimates from the U.S. Census Bureau. ⚠️ Caveats: Point-in-time counts were conducted in January, 2024 by local Continuums of Care (CoCs), with latitude in methodology. They risk undercounting unsheltered populations, people couch‑surfing, or those avoiding contact. High Housing Costs & Homelessness Hawaii tops the ranking with 805 people experiencing homelessness for every 100,000 residents. This is more than three times the national average of 227. RankStateState CodeHomelessness per 100,000 ResidentsOverall Homeless Population1HawaiiHI80511,6372District of ColumbiaDC8005,6163New YorkNY795158,0194OregonOR53522,8755VermontVT5333,4586CaliforniaCA474187,0847MassachusettsMA41129,3608WashingtonWA39631,5549AlaskaAK3632,68610ColoradoCO31418,71511NevadaNV30910,10612Rhode IslandRI2202,44213New MexicoNM2174,63114IllinoisIL20325,83215ArizonaAZ19414,73716MaineME1922,70217MontanaMT1772,00818New HampshireNH1592,24519MinnesotaMN1599,20120South DakotaSD1451,33821IdahoID1372,75022NebraskaNE1362,72023New JerseyNJ13412,76224FloridaFL13431,36225OklahomaOK1335,46726DelawareDE1291,35827MissouriMO1177,31228TennesseeTN1158,28029KentuckyKY1145,23130UtahUT1103,86931GeorgiaGA11012,29032North DakotaND10986533PennsylvaniaPA10814,08834North CarolinaNC10511,62635West VirginiaWV1011,77936OhioOH9911,75937MarylandMD976,06938MichiganMI969,73939KansasKS942,79340ConnecticutCT933,41041IndianaIN916,28542ArkansasAR902,78343TexasTX8927,98744AlabamaAL894,60145WyomingWY8550146WisconsinWI855,04947South CarolinaSC844,59348IowaIA812,63149VirginiaVA817,14150LouisianaLA753,46951MississippiMS351,041 N/AU.S.USA227771,480 Washington, D.C. is next at 800, reflecting the high cost of living and limited affordable housing in the nation’s capital. New York ranks third at 795, driven largely by the concentrated shelter population in New York City. Together, these three jurisdictions account for nearly 175,000 unhoused individuals. West Coast Living Costs Pressures Push Numbers Higher Four West Coast states—Oregon, California, Washington, and Alaska—sit firmly in the top 10. Oregon’s rate has climbed to 535 amid rising rents in Portland, while California’s 187,000 unhoused people represent the largest absolute total in the country. Seattle’s booming technology sector and limited housing supply help push Washington to nearly 400 per 100,000. These states share a common thread: home prices that have consistently outpaced wage growth, leaving some residents on the brink of housing insecurity. 📊 Related: Look at the newest data around average house prices in each U.S. state. Southern and Midwestern States See Lower Rates At the opposite end of the spectrum, Southern and Midwestern states generally report far lower rates. Mississippi posts the lowest figure—just 35 people per 100,000—followed by Louisiana (75) and Virginia (81). Lower housing costs, sprawling land availability, and fewer large metro areas likely contribute to these lower rates, although undercounts in rural regions remain a challenge. Even populous states such as Texas and Florida fall near the middle of the pack at 89 and 134 respectively, showing that population alone does not dictate homelessness levels. Overall, the data underscore a powerful link between housing affordability and homelessness. States with soaring rents and tight markets consistently rank higher, while those with more modest housing costs tend to fare better.