By Cheng Xin,Contributor,Trefis Team
Copyright forbes

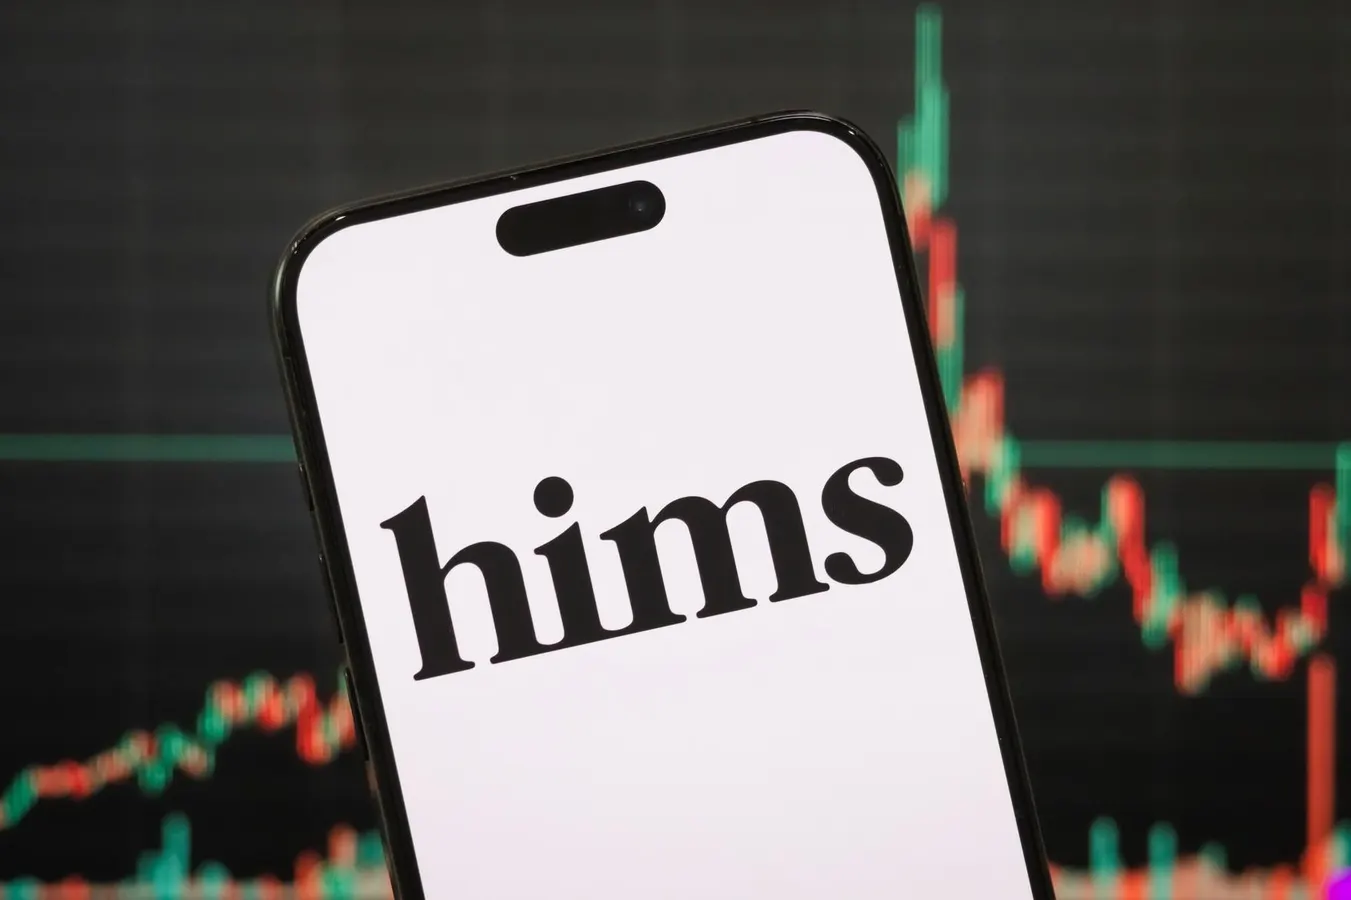
CHONGQING, CHINA – MAY 04: In this photo illustration, the logo of Hims & Hers Health, Inc. is displayed on a smartphone screen, with the company’s stock market performance and candlestick chart visible in the background, on May 4, 2025, in Chongqing, China. Hims & Hers is an American telehealth company that provides personalized healthcare products and services for mental health, dermatology, sexual wellness, and primary care through a direct-to-consumer platform. (Photo illustration by Cheng Xin/Getty Images)
Getty Images
Hims & Hers stock (NASDAQ: HIMS) has recently witnessed a remarkable rebound, climbing 42% over the last month from approximately $42 to its current price of $59. This significant increase is primarily due to the announcement that a U.S. federal judge dismissed a lawsuit brought by Eli Lilly against a rival telehealth company, Willow Health, on September 2, 2025.
Earlier this year, Eli Lilly had initiated a lawsuit against Willow Health along with three other telehealth companies concerning the sale of compounded versions of tirzepatide. This ingredient is found in Lilly’s branded weight-loss medications, Zepbound and Mounjaro. Hims & Hers itself is facing class-action complaints from investors and significant regulatory scrutiny regarding its own compounded GLP-1 drug offerings. The dismissal of the lawsuit from Eli Lilly against Willow Health greatly alleviated investor concerns about potential legal and litigation risks for Hims, which was the main catalyst for the jump in stock price.
The key question now is whether HIMS stock is a good buy following its 42% rally. While the company clearly exhibits strong operational performance and financial soundness—as discussed in further analysis—its valuation seems high at current price levels after the considerable surge.
Our Stock Opinion – HIMS
That being said, if you are looking for potential gains with less volatility compared to holding an individual stock, consider the High Quality Portfolio. It has consistently outperformed its benchmark—a mix of the S&P 500, Russell, and S&P MidCap indexes—and has achieved returns of over 91% since its inception. Why is this the case? Collectively, HQ Portfolio stocks have provided superior returns with lower risk in comparison to the benchmark index; less of a roller coaster effect, as shown in HQ Portfolio performance metrics. Additionally, see – How Can RIOT Platforms Value Double?
MORE FOR YOU
Let’s delve into details of each of the assessed factors, but before that, for quick background: With $13 Bil in market cap, Hims & Hers Health offers a telehealth platform that connects consumers to licensed professionals, providing non-prescription wellness supplements and medical consultations through direct and wholesale channels.
[1] Valuation Looks Very High
HIMS Stock Valuation
This table illustrates how HIMS is valued against the broader market. For more details see: HIMS Valuation Ratios
[2] Growth Is Very Strong
Hims & Hers Health has witnessed an average growth rate of 76.3% over the past 3 years
Its revenues have increased by 89% from $1.1 Bil to $2.0 Bil in the last 12 months
Moreover, its quarterly revenues climbed 72.6% to $545 Mil in the latest quarter from $316 Mil a year ago.
HIMS Revenue Growth
This table highlights how HIMS is expanding in comparison to the broader market. For more details see: HIMS Revenue Comparison
[3] Profitability Appears Weak
HIMS’ operating income for the last 12 months was $126 Mil, indicating an operating margin of 6.2%
With a cash flow margin of 13.0%, it generated nearly $262 Mil in operating cash flow during this period
For the same timeframe, HIMS reported nearly $194 Mil in net income, reflecting a net margin of approximately 9.6%
HIMS Profitability
This table presents HIMS profitability in relation to the broader market. For more details see: HIMS Operating Income Comparison
[4] Financial Stability Looks Very Strong
HIMS had $1.0 Bil in debt at the close of the most recent quarter, while its current Market Cap is $13 Bil. This results in a Debt-to-Equity Ratio of 7.9%
HIMS Cash (including cash equivalents) constitutes $1.1 Bil of $1.9 Bil in total Assets. This results in a Cash-to-Assets Ratio of 61.0%
HIMS Financial Stability
[5] Downturn Resilience Is Moderate
HIMS demonstrated slightly better performance than the S&P 500 index during various economic downturns. We evaluate this based on both (a) how far the stock declined and (b) how rapidly it bounced back. Additionally, see – Buy or Fear HIMS Stock
2022 Inflation Shock
HIMS stock declined by 87.3% from a peak of $24.46 on 8 February 2021 to $3.11 on 11 May 2022, compared to a peak-to-trough decrease of 25.4% for the S&P 500.
However, the stock fully rebounded to its pre-Crisis peak by 18 June 2024
Since then, the stock has risen to a peak of $68.74 on 19 February 2025, and it is currently trading at $59.12
HIMS Stock Performance During The 2022 Inflation Shock
2020 COVID-19 Pandemic
HIMS stock dropped 14.7% from a peak of $11.75 on 30 September 2020 to $10.02 on 28 October 2020, while the S&P 500 experienced a peak-to-trough decline of 33.9%.
However, the stock fully recovered to its pre-Crisis peak by 7 December 2020
HIMS Stock Performance During The 2020 COVID-19 Pandemic
However, the risks are not confined to significant market crashes. Stocks may decline even in favorable markets – consider events like earnings reports, business updates, or changes in outlook. Read HIMS Dip Buyer Analyses to learn how the stock has bounced back from significant dips in the past.
Bear in mind, investing in a single stock without thorough analysis can be precarious. Consider the Trefis Reinforced Value (RV) Portfolio, which has consistently outperformed its all-cap stocks benchmark (a mixture of the S&P 500, S&P mid-cap, and Russell 2000 benchmark indices), yielding strong returns for investors. Why is this notable? The quarterly rebalanced mix of large-, mid-, and small-cap RV Portfolio stocks allows for an adaptive approach to capitalize on favorable market conditions while limiting downturn losses, as described in RV Portfolio performance metrics.
Editorial StandardsReprints & Permissions


