While gas prices remain notably higher than only a few years ago, the portion of their income Americans spend on fuel varies significantly from state to state.
According to a recent study by personal financial website FinanceBuzz, this ranges from 0.8 percent to 3..7 percent, depending on such factors as median household income, state-level gas prices as well as drivers’ average monthly mileage.
Why It Matters
Gas prices have been trending downward in recent weeks, according to data from the American Automobile Association (AAA) as well as the Department of Labor’s latest consumer price index (CPI). However, these remain notably above pre-COVID levels, and are proving a further strain on household budgets already burdened by surging utility costs and elevated inflation.
What To Know
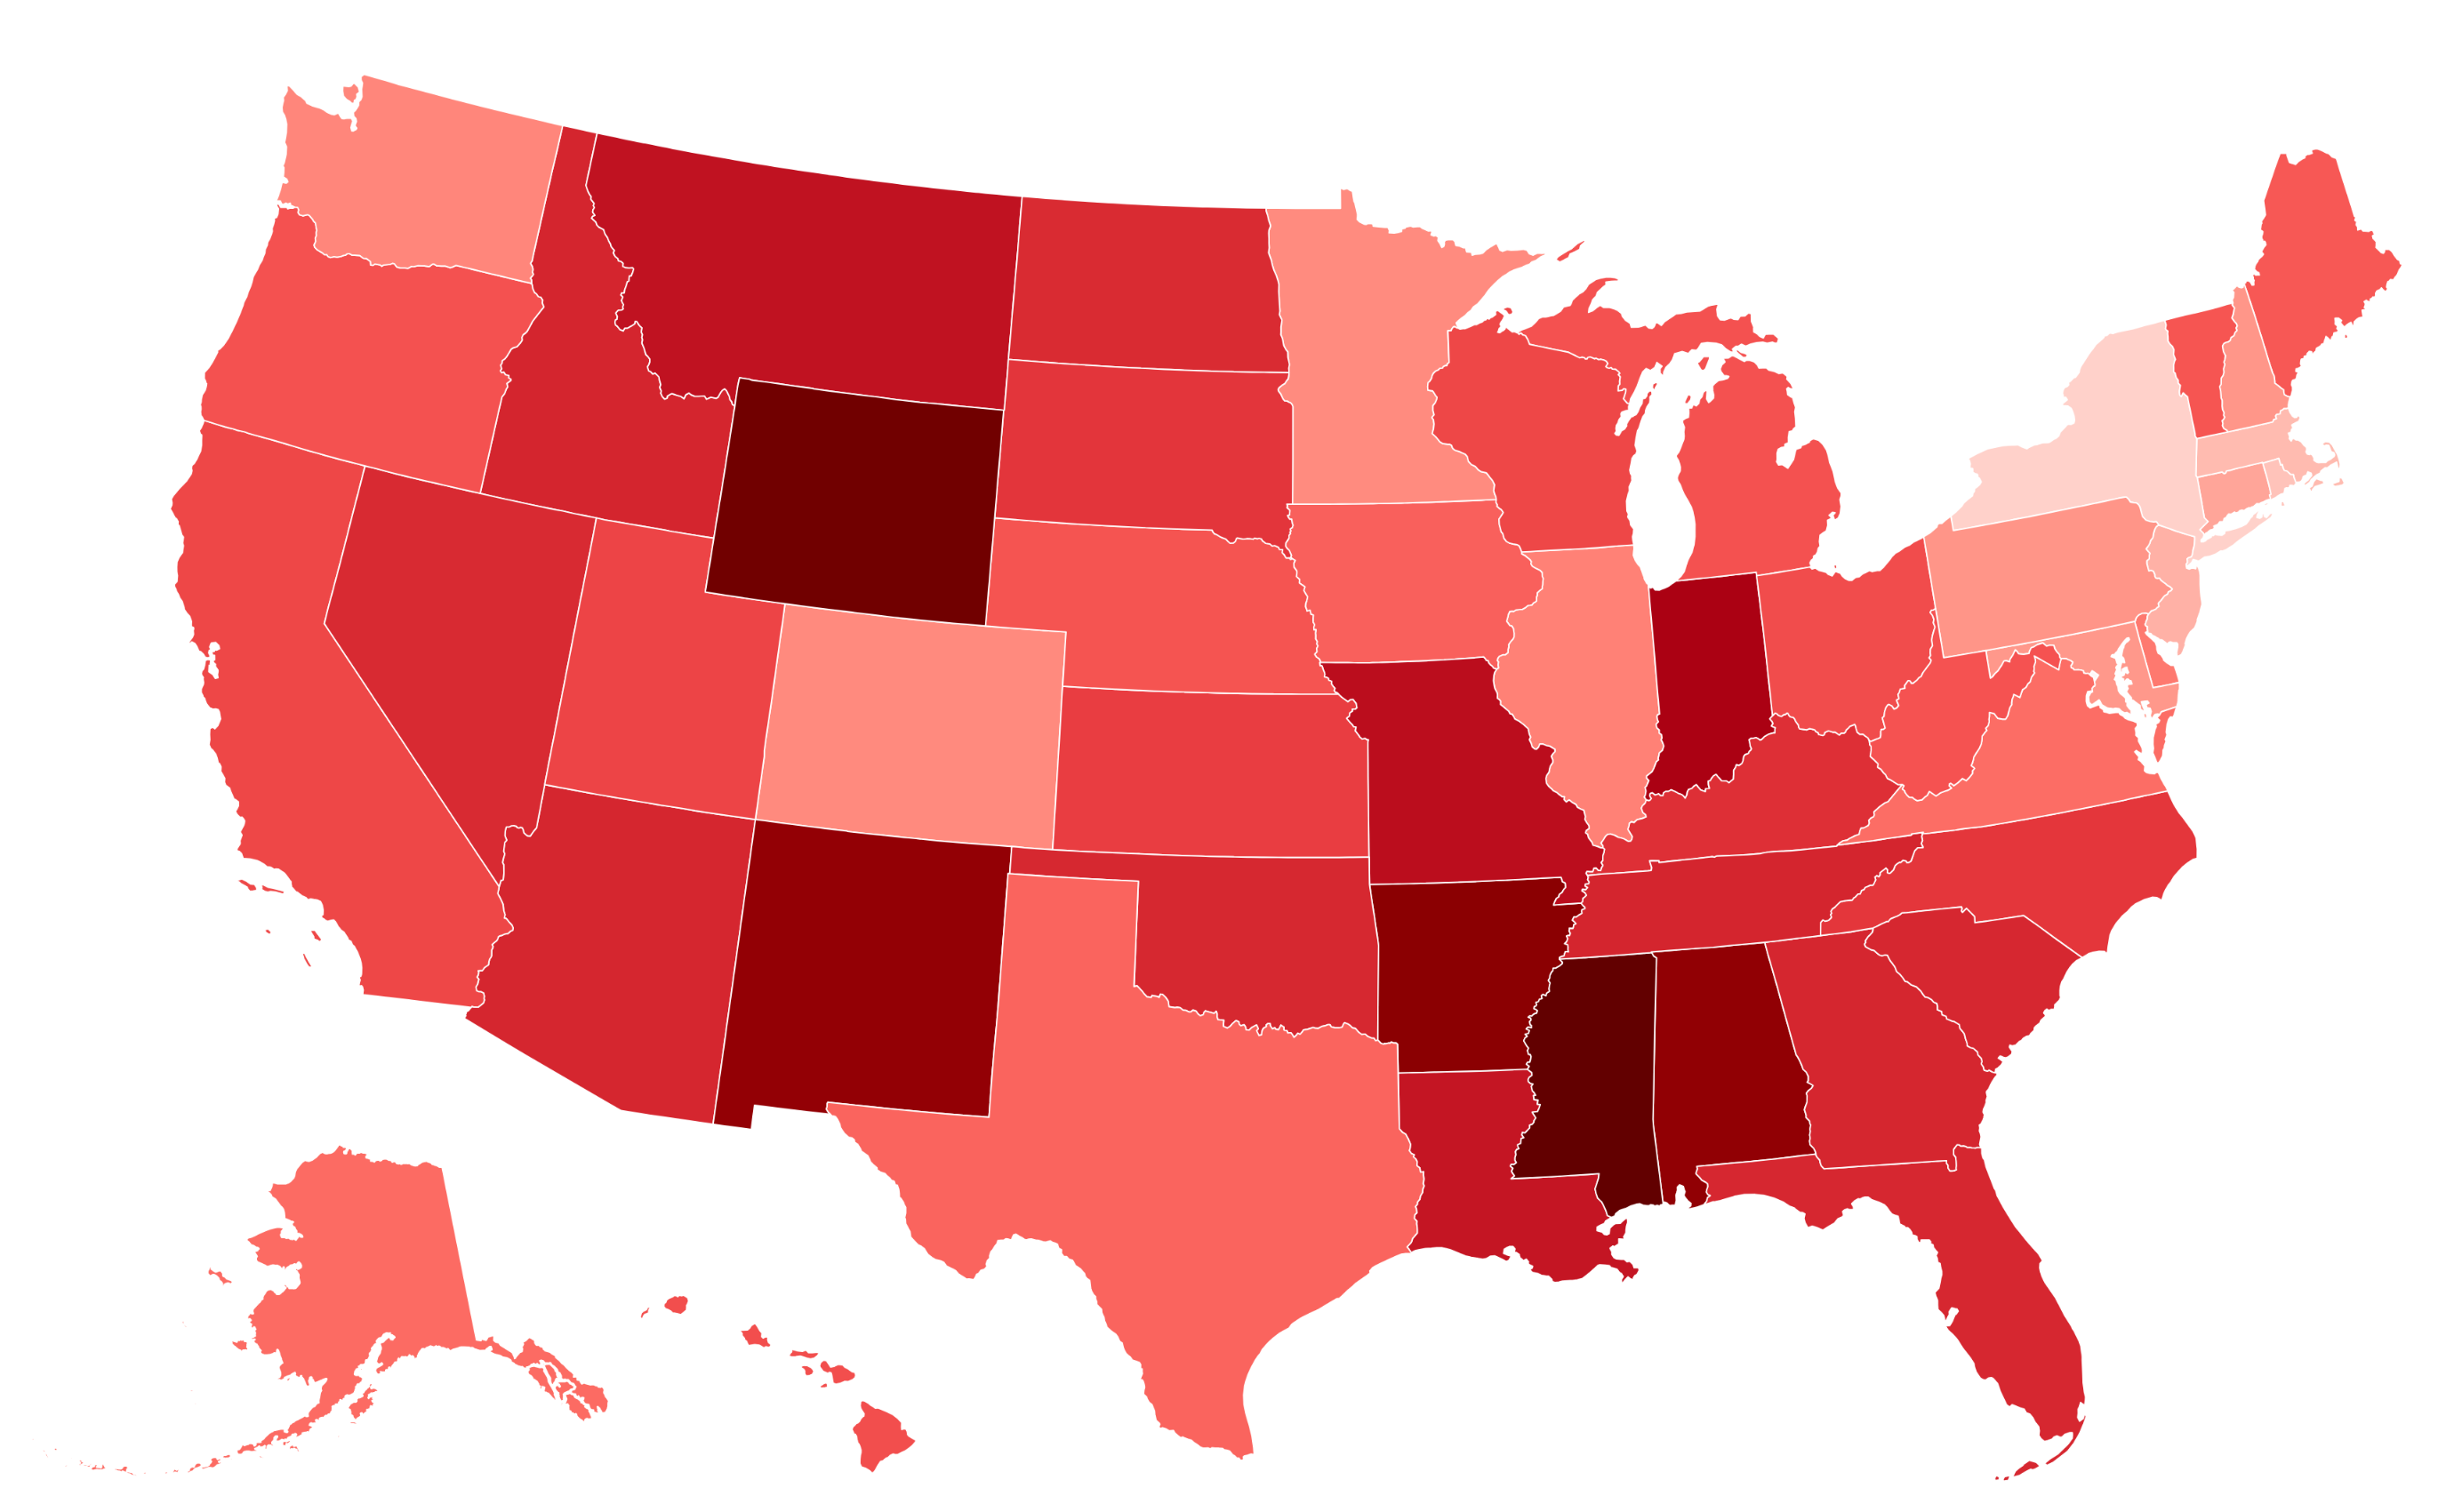
FinanceBuzz charted the median income in each state alongside their gas prices and average monthly mileage to work out what percentage of Americans’ earnings are spent on fuel. According to its calculations—based on data from the AAA, Census Bureau and Department of Transportation—the average American driver spends 2.3 percent of their monthly income on gas. However, this figure varies significantly across the U.S.
In first place was Mississippi, where drivers spend 3.7 percent of their monthly income on gas, despite the state having one of the country’s lowest median gas prices at $2.69, compared with the national average of $3.16. This is due to Mississippi drivers travelling nearly 400 miles more per month than the average American, as well as their average income of $3,844 being the lowest in the nation.
Mississippi is followed by Wyoming and Arkansas—also states with lower than average income and above-average mileage—where drivers spend 3.6 and 3.5 percent of their monthly income on gas, respectively.
By contrast, Washington D.C. drivers spend only 0.8 percent of their income on fuel. This reflects the capital’s high median monthly household income of $8,396—thousands more than the national average of $5,006—and the fact that D.C. residents travel only 440 miles per month, compared to 816 miles nationally.
After D.C., New York and Rhode Island spend the lowest share of their earnings on gas, at 1.2 and 1.4 percent, respectively.
What People Are Saying
Josh Koebert, researcher at FinanceBuzz, told Newsweek: “The states where residents spend the highest percentage of their income on gas tend to be states with low population density, like Mississippi, Wyoming, and Arkansas. Gas prices in these states are actually some of the lowest in the country, but because everything is so spread out and there are fewer major urban centers, people simply have to drive further and more often compared to states with high population density and lots of big cities (and the public transportation options cities tend to have).”
“People who live in those lower-density states drive two to three times as many miles per month compared to people who live in places where gas is notably more expensive, like New York State or the New England region,” he added. “Because of that disparity, drivers in places like Wyoming and Mississippi have to fill and refill their gas tanks much more often, resulting in higher overall spending on gas despite having cheaper prices at the pump.”
What Happens Next?
The amount Americans spend on gas is on track for further declines, according to recent forecasts from the U.S. Energy Information Administration (EIA). Last week, the federal agency predicted that gasoline could fall to their lowest level since 2005 this year, excluding the COVID-affected figures from 2020.
“We estimate expenditures will average less than 2 percent of disposable income this year, down from an average of 2.4 percent over the previous decade,” the EIA said.