New Census Bureau data highlights sharp contrasts in poverty across the U.S., with some states reporting rates nearly three times higher than others.
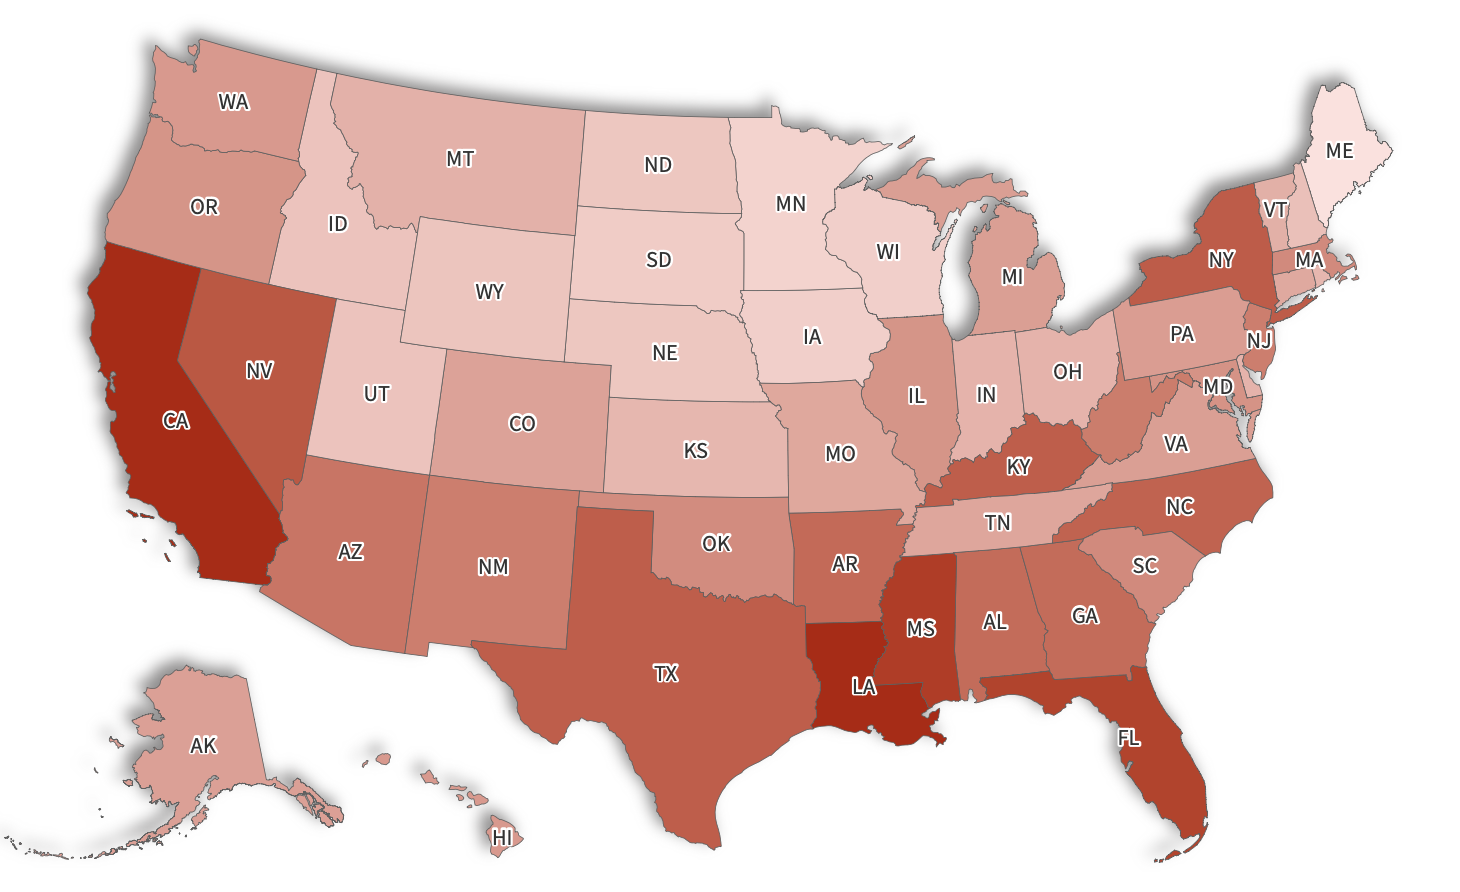
Over the three-year period from 2022 through 2024, California and Louisiana posted the highest rates under the Supplemental Poverty Measure (SPM), with 17.7 percent of residents living in poverty.
The SPM provides a broad picture of economic hardship. It counts government benefits such as SNAP (Supplemental Nutrition Assistance Program), housing aid, and tax credits, while subtracting necessary costs such as taxes, medical bills, and work expenses.
It also adjusts thresholds for food, clothing, shelter, and utilities based on housing status and local costs.
States With the Highest Poverty
California and Louisiana topped the list at 17.7 percent, followed by Mississippi at 16.4 percent, Florida at 16.0 percent, and the District of Columbia at 15.3 percent.
Dr. Mark Pingle, Professor of Economics at the University of Nevada, Reno, said Louisiana’s high rate reflects a broader regional trend.
“Louisiana, as a Southern State, has a relatively high poverty rate, not much greater than the high rates of the other deep south states: Mississippi, Alabama, Arkansas, and Florida,” he told Newsweek.
“These high poverty rates are largely explained by the lower rates of educational attainment, where economic development in cities has not been as rapid as in other states,” he added.
In California, Pringle says economic shifts have created deep divides.
“California once had a much lower relative poverty rate, one of the strongest economies in the nation by this measure. The large amount of immigrate lower skilled labor has changed the California economy into one where highly skilled and highly educated workers live very well, but the masses of lower skill and lower educated workers do not live as well as people in other states, face a greater likelihood of unemployment, and are more likely to fall below the poverty line,” he said.
States With the Lowest Poverty
At the other end of the spectrum, Maine recorded the lowest poverty rate at 6.7 percent, followed by Minnesota at 7.5 percent. Wisconsin and Iowa tied at 7.7 percent, while South Dakota stood at 7.9 percent.
Usha Haley, Barton Distinguished Chair in International Business at Wichita State University, pointed to the factors behind these lower rates.
“Minnesota and Maine have some of the nation’s lowest SPM poverty rates [because] they benefit from relatively affordable housing markets, robust social safety nets, and higher labor force participation.
“Investments in education, workforce development, and healthcare access also reduce vulnerability to economic shocks,” she told Newsweek.
National Picture
Across the country, the overall poverty rate under the SPM was 12.7 percent.
Pingle noted that while changes to federal programs often generate debate, long-term data suggests stability.
“I would not anticipate a dramatic change. If you look at the data, one very interesting fact is that the poverty rate in the U.S. decreased rather steadily from World War II to the early 1960s. Since the advent of Medicaid and increase in other transfer payment programs such as SNAP, the poverty rate has fluctuated around the roughly the same level, not much change since the mid-1960s,” he said.
He added that poverty is not necessarily permanent for some households: “A small share of the population remains in poverty, but for the most part people who are in poverty during one survey period move out of it over time.
“Educational attainment, skill development aside from formal education, and healthy economic development are the keys to reducing unemployment, reducing poverty, reducing dependency on transfer payment programs, and raising living standards.”